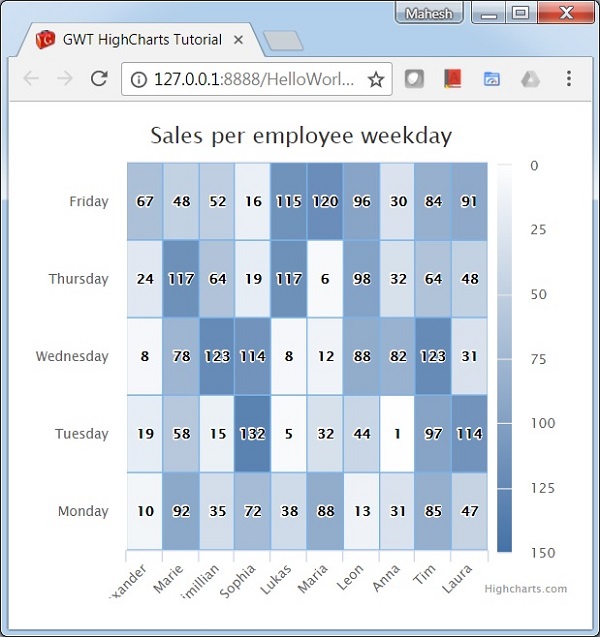
GWT Highcharts - 热图图表
以下是热图图表的示例。
我们已经在Highcharts 配置语法一章中看到了用于绘制图表的配置。
下面给出了热图图表的示例。
配置
现在让我们看看采取的其他配置/步骤。
图表
将图表类型配置为基于"热图"。chart.type决定图表的系列类型。在这里,默认值为"线"。
chart.setType(Type.HEATMAP);
示例
HelloWorld.java
package com.tutorialspoint.client;

import org.moxieapps.gwt.highcharts.client.Chart;
import org.moxieapps.gwt.highcharts.client.ColorAxis;
import org.moxieapps.gwt.highcharts.client.Legend;
import org.moxieapps.gwt.highcharts.client.Series;
import org.moxieapps.gwt.highcharts.client.Style;
import org.moxieapps.gwt.highcharts.client.ToolTip;
import org.moxieapps.gwt.highcharts.client.ToolTipData;
import org.moxieapps.gwt.highcharts.client.ToolTipFormatter;
import org.moxieapps.gwt.highcharts.client.labels.DataLabels;
import org.moxieapps.gwt.highcharts.client.plotOptions.HeatmapPlotOptions;

import com.google.gwt.core.client.EntryPoint;
import com.google.gwt.user.client.ui.RootPanel;

public class HelloWorld implements EntryPoint {
   public void onModuleLoad() {
      final Chart chart = new Chart()
         .setType(Series.Type.HEATMAP)
         .setMarginTop(40)
         .setMarginBottom(40)
         .setChartTitleText("Sales per employee weekday");

      chart.getXAxis()
         .setCategories("Alexander", "Marie", "Maximillian", "Sophia", "Lukas", "Maria", "Leon", "Anna", "Tim", "Laura");

      chart.getYAxis()
         .setCategories("Monday", "Tuesday", "Wednesday", "Thursday", "Friday")
         .setAxisTitle(null);

      chart.setColorAxis(new ColorAxis()
         .setMin(0)
         .setMinColor("#FFFFFF")
         .setMaxColor("#4572A7")
      );

      chart.setLegend(new Legend()
         .setAlign(Legend.Align.RIGHT)
         .setLayout(Legend.Layout.VERTICAL)
         .setMargin(0)
         .setVerticalAlign(Legend.VerticalAlign.TOP)
         .setY(25)
         .setSymbolHeight(320)
      );

      chart.setToolTip(new ToolTip()
         .setFormatter(new ToolTipFormatter() {
            @Override
            public String format(ToolTipData toolTipData) {
               return toolTipData.getPoint().getValue() + " items on ";
            }
         })
      );

      chart.addSeries(chart.createSeries()
         .setOption("borderWidth", 1)
         .setName("Sales per employee")
         .setPlotOptions(new HeatmapPlotOptions()
            .setDataLabels(new DataLabels()
               .setEnabled(true)
               .setColor("#000000")
               .setStyle(new Style()
                  .setOption("textShadow", "none")
                  .setOption("HcTextStroke", null)
               )
            )
         )
         .setPoints(new Number[][]{
            {0, 0, 10}, {0, 1, 19}, {0, 2, 8}, {0, 3, 24}, {0, 4, 67},
            {1, 0, 92}, {1, 1, 58}, {1, 2, 78}, {1, 3, 117}, {1, 4, 48},
            {2, 0, 35}, {2, 1, 15}, {2, 2, 123}, {2, 3, 64}, {2, 4, 52},
            {3, 0, 72}, {3, 1, 132}, {3, 2, 114}, {3, 3, 19}, {3, 4, 16},
            {4, 0, 38}, {4, 1, 5}, {4, 2, 8}, {4, 3, 117}, {4, 4, 115},
            {5, 0, 88}, {5, 1, 32}, {5, 2, 12}, {5, 3, 6}, {5, 4, 120},
            {6, 0, 13}, {6, 1, 44}, {6, 2, 88}, {6, 3, 98}, {6, 4, 96},
            {7, 0, 31}, {7, 1, 1}, {7, 2, 82}, {7, 3, 32}, {7, 4, 30},
            {8, 0, 85}, {8, 1, 97}, {8, 2, 123}, {8, 3, 64}, {8, 4, 84},
            {9, 0, 47}, {9, 1, 114}, {9, 2, 31}, {9, 3, 48}, {9, 4, 91}
         })
      );
      RootPanel.get().add(chart);
   }
}
结果
验证结果。
 gwt_highcharts_map_charts.html


