如何在 R 中使用 ggplot2 在绘图区域外写入文本?
r programmingserver side programmingprogramming更新于 2025/6/24 8:37:17
要使用 ggplot2 在绘图区域外写入文本,我们可以使用 annotate 函数和 coord_cartesian 函数。annotate 函数将定义文本值,而 coord_cartesian 函数将定义文本在绘图区域外的位置。
查看以下示例以了解其工作原理。
示例
以下代码片段创建了一个示例数据框 −
x<-rnorm(20)
y<-rnorm(20)
df<-data.frame(x,y)
df
创建以下数据框 −
        x             y
1  -0.40472483  -0.07760919
2  -0.09077911   0.40705712
3   0.04122442  -0.67552070
4  -0.78520861  -0.24918263
5  -1.38592400   0.67534026
6  -0.68027757   1.06726703
7  -0.73141825  -0.01776461
8   0.09336187   0.27947009
9   0.38625538  -0.34174606
10 -0.18627279   1.00174991
11 -1.68310315  -0.29876124
12  1.33719646  -0.13991965
13 -0.70679075  -0.11464434
14 -1.54770217   2.61299815
15  1.55050758   0.82286414
16  0.30323709   0.58833182
17  0.36705970  -2.12925379
18  0.77242047  -1.54357138
19  1.13557728   0.04046488
20 -0.09440322  -0.94294441
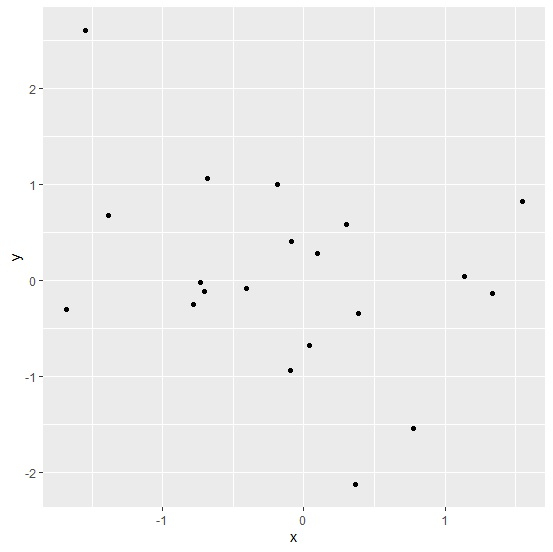
要加载 ggplot2 包并在 x 和 y 之间创建点图,请将以下代码添加到上面的代码片段中 −
library(ggplot2)
ggplot(df,aes(x,y))+geom_point()
输出
如果将上述所有代码片段作为单个程序执行,则会生成以下输出 −
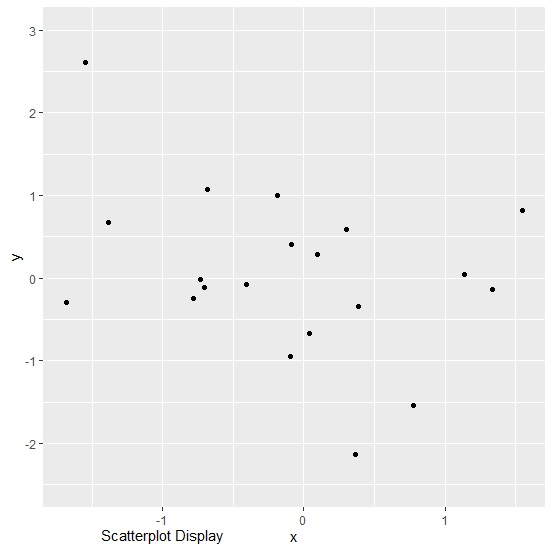
要在 x 和 y 之间创建点图,并在图外添加文本,请将以下代码添加到上述代码片段中 −
ggplot(df,aes(x,y))+geom_point()+annotate("text",x=-1,y=-3.1,label="Scatterplot Display")+coord_cartesian(ylim=c(-2.5,3),clip="off")
输出
如果将上述所有代码片段作为单个程序执行,则会生成以下输出 −