如何在 R 中移除 ggplot2 创建的图例周围的方框?
r programmingserver side programmingprogramming更新于 2025/6/27 17:22:17
当我们使用 ggplot2 创建带有图例的图时,图例值会被方框覆盖,这会影响图的平滑度。可以移除图例值周围的方框,使图表对查看者更具吸引力。这可以通过在 theme 函数中将 legend.key 元素设置为空来实现。
示例
考虑以下数据框 −
set.seed(1)
x<-rnorm(20)
y<-rpois(20,2)
Group<-rep(c("A","B","C","D"),times=5)
df<-data.frame(x,y,Group)
df
输出
  x    y    Group
1   -0.62645381 3 A
2   0.18364332 2 B
3  -0.83562861 3 C
4   1.59528080 2 D
5   0.32950777 2 A
6  -0.82046838 3 B
7   0.48742905 0 C
8   0.73832471 2 D
9   0.57578135 3 A
10 -0.30538839 3 B
11  1.51178117 2 C
12  0.38984324 4 D
13 -0.62124058 2 A
14 -2.21469989 1 B
15  1.12493092 0 C
16 -0.04493361 0 D
17 -0.01619026 1 A
18  0.94383621 2 B
19  0.82122120 2 C
20  0.59390132 2 D
> library(ggplot2)
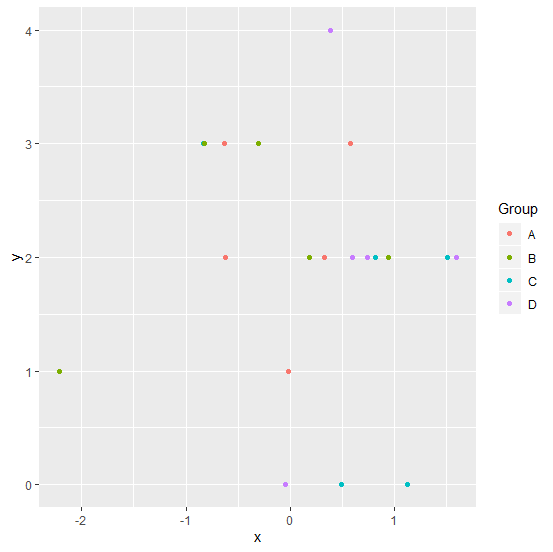
创建不同颜色组的散点图 −
ggplot(df,aes(x,y,color=Group))+geom_point()
输出
这里,我们获取了方框中的图例颜色。如果想要去除这些方框,可以使用 theme 函数,如下所示 −
ggplot(df,aes(x,y,color=Group))+geom_point()+theme(legend.key=element_blank())
输出


