如何在 R 中使用 ggplot2 增加坐标轴的宽度?
r programmingserver side programmingprogramming更新于 2025/4/8 8:22:17
要在 R 中使用 ggplot2 增加坐标轴的宽度(同时增加 X 轴和 Y 轴的宽度),我们可以使用 theme 函数并传入 axis.line 参数,其中 element_line 参数可以设置为更大的值。
查看下面的示例,了解如何操作。
示例
以下代码片段创建了一个示例数据框 −
x<-sample(0:9,20,replace=TRUE)
y<-sample(0:9,20,replace=TRUE)
df<-data.frame(x,y)
df
创建以下数据框
   x y
 1 6 9
 2 7 8
 3 1 3
 4 2 4
 5 1 2
 6 2 5
 7 2 4
 8 1 6
 9 4 1
10 7 6
11 0 8
12 9 0
13 9 4
14 1 8
15 6 5
16 7 7
17 0 0
18 6 7
19 1 6
20 6 8
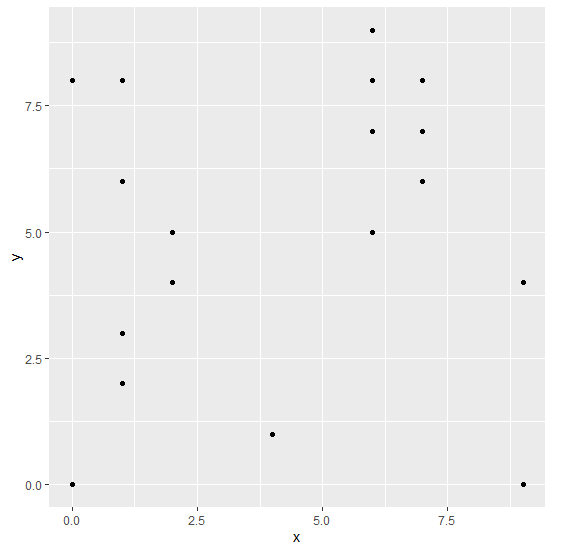
要加载 ggplot2 包并在上面创建的数据框中创建 x 和 y 之间的散点图,请将以下代码添加到上面的代码片段中 −
x<-sample(0:9,20,replace=TRUE)
y<-sample(0:9,20,replace=TRUE)
df<-data.frame(x,y)
library(ggplot2)
ggplot(df,aes(x,y))+geom_point()
输出
如果将上述所有代码片段作为单个程序执行,则会生成以下输出 −
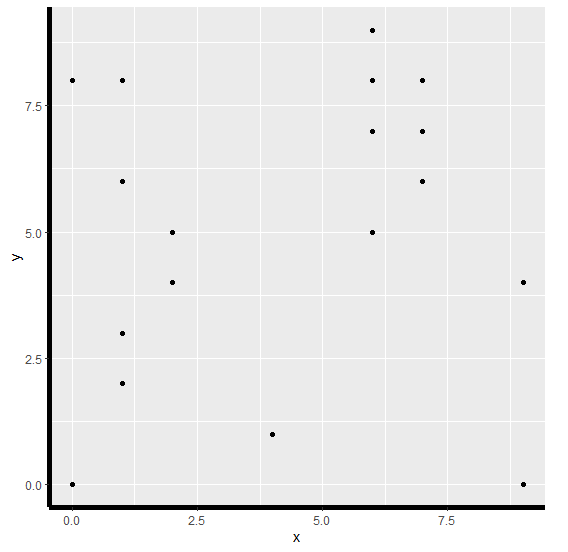
要在上述数据框中创建 x 和 y 之间的散点图,并增加两个轴的宽度,请将以下代码添加到上述代码片段中 −
x<-sample(0:9,20,replace=TRUE)
y<-sample(0:9,20,replace=TRUE)
df<-data.frame(x,y)
library(ggplot2)
ggplot(df,aes(x,y))+geom_point()+theme(axis.line=element_line(size=2))
输出
如果将上述所有代码片段作为单个程序执行,则会生成以下输出 −