如何在 R 中使用 ggplot2 创建累积总和点图?
r programmingserver side programmingprogramming更新于 2025/4/12 3:22:17
要使用 ggplot2 创建累积总和点图,我们需要在 aes 函数中使用 cumsum 函数作为因变量,以进行描述变量如何绘制的美学映射。例如,如果我们有一个数据框 df,其中包含列 x 和 y,其中 y 是因变量,那么累积总和点图可以创建为 ggplot(df,aes(1:20,y=cumsum(y)))+geom_point()。
示例
考虑下面的数据框 −
set.seed(666)
x<-1:20
y<-rpois(20,5)
df<-data.frame(x,y)
df
输出
  x y
1 1 7
2 2 3
3 3 10
4 4 3
5 5 4
6 6 6
7 7 10
8 8 5
9 9 1
10 10 3
11 11 7
12 12 1
13 13 2
14 14 3
15 15 3
16 16 7
17 17 1
18 18 8
19 19 5
20 20 5
加载 ggplot2 包并创建累积总和点图 −
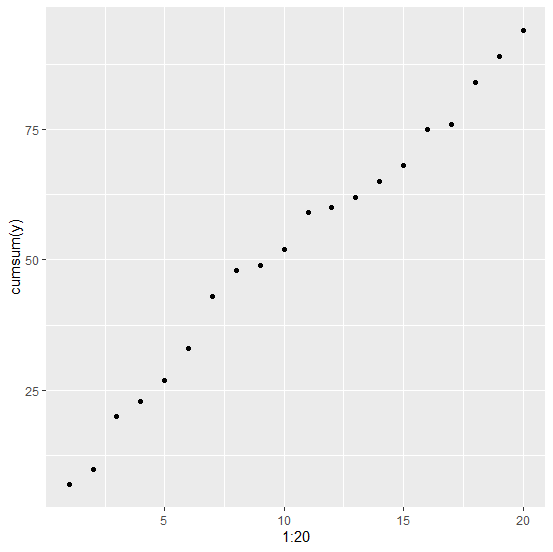
library(ggplot2)
ggplot(df,aes(1:20,y=cumsum(y)))+geom_point()
输出