Matplotlib 中 Poly3DCollection 图的透明度
matplotlibpythondata visualization更新于 2023/11/15 9:32:00
要在 Matplotlib 中绘制透明的 Poly3DCollection 图,我们可以采取以下步骤 −
- 设置图形大小并调整子图之间和周围的填充
- 创建新图形或激活现有图形。
- 将 '~.axes.Axes' 添加到图形中,作为 projection=3d 子图布置的一部分。
- 创建 x、y 和 z 数据点。
- 创建顶点列表。
- 将 x、y 和 z 数据点转换为压缩列表元组。
- 获取 Poly3d 实例列表。
- 使用 add_collection3d() 方法将 3D 集合对象添加到绘图中。
- 关闭轴。
- 要显示图形,请使用 show() 方法。
示例
from matplotlib import pyplot as plt
from mpl_toolkits.mplot3d.art3d import Poly3DCollection, Line3DCollection
plt.rcParams["figure.figsize"] = [7.50, 3.50]
plt.rcParams["figure.autolayout"] = True
fig = plt.figure()
ax = fig.add_subplot(111, projection='3d')
x = [0, 2, 1, 1]
y = [0, 0, 1, 0]
z = [0, 0, 0, 1]
vertices = [[0, 1, 2], [0, 1, 3], [0, 2, 3], [1, 2, 3]]
tupleList = list(zip(x, y, z))
poly3d = [[tupleList[vertices[ix][iy]]
for iy in range(len(vertices[0]))]
for ix in range(len(vertices))]
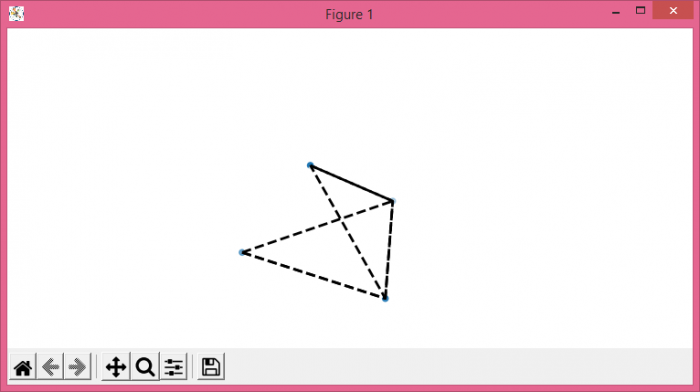
ax.scatter(x, y, z)
ax.add_collection3d(Poly3DCollection(poly3d, facecolors='w', linewidths=1, alpha=0.5))
ax.add_collection3d(Line3DCollection(poly3d, colors='k', linewidths=2, linestyles='--'))
plt.axis('off')
plt.show()
输出