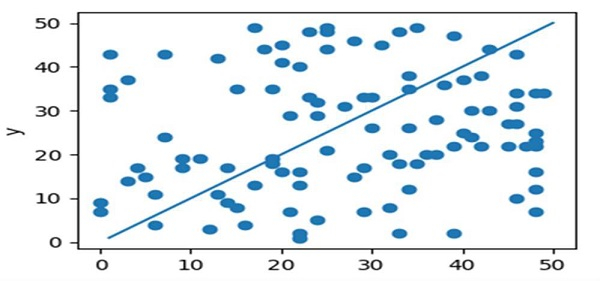
如何在 Python 中在散点图上叠加绘制一条线?
pythonmatplotlibserver side programmingprogramming更新于 2024/1/18 8:06:00
首先,我们可以使用 scatter 方法为不同的数据点创建散点图,然后,我们可以使用 plot 方法绘制线条。
步骤
使用 figure() 方法创建一个新图形,或激活一个图形大小为 (4, 3) 的现有图形。
向当前图形添加一个轴并使其成为当前轴,使用 plt.axes() 创建 x。
使用 scatter() 方法绘制散点。
使用 ax.plot() 方法绘制线条。
使用 plt.xlabel() 方法设置 X 轴标签。
使用 plt.ylabel() 设置 Y 轴标签方法。
要显示图表,请使用 plt.show() 方法。
示例
import random
import matplotlib.pyplot as plt

plt.figure(figsize=(4, 3))
ax = plt.axes()
ax.scatter([random.randint(1, 1000) % 50 for i in range(100)],
[random.randint(1, 1000) % 50 for i in range(100)])
ax.plot([1, 2, 4, 50], [1, 2, 4, 50])

ax.set_xlabel('x')
ax.set_ylabel('y')

plt.show()
输出


