使用 Matplotlib 和 NumPy 在图像上绘制圆圈
matplotlibpythondata visualization
要使用 matplotlib 和 numpy 在图像上绘制圆圈,我们可以采取以下步骤 −
设置图形大小并调整子图之间和周围的填充。
将文件中的图像读入数组。
使用 numpy 创建 x 和 y 数据点。
使用 subplots() 方法创建一个图形和一组子图。
使用 imshow() 方法将数据显示为图像,即在 2D 常规栅格上。
关闭轴。
在当前轴。
要显示图形,请使用 show() 方法。
示例
import matplotlib.pyplot as plt
import numpy as np
from matplotlib.patches import Circle
plt.rcParams["figure.figsize"] = [7.50, 3.50]
plt.rcParams["figure.autolayout"] = True
img = plt.imread('bird.jpg')
x = np.random.rand(5) * img.shape[1]
y = np.random.rand(5) * img.shape[0]
fig, ax = plt.subplots(1)
ax.imshow(img)
ax.axis('off')
for xx, yy in zip(x, y):
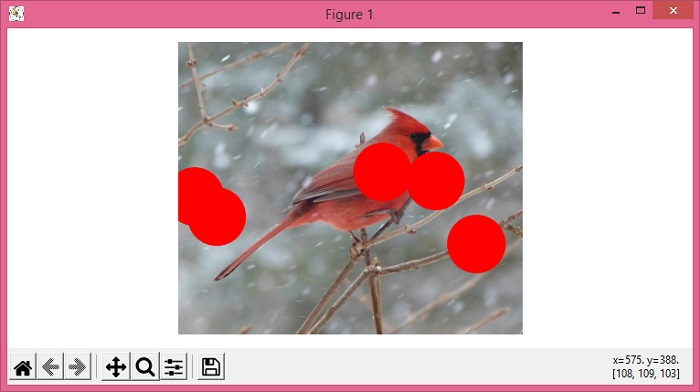
circ = Circle((xx, yy), 50, color='red')
ax.add_patch(circ)
plt.show()
输出