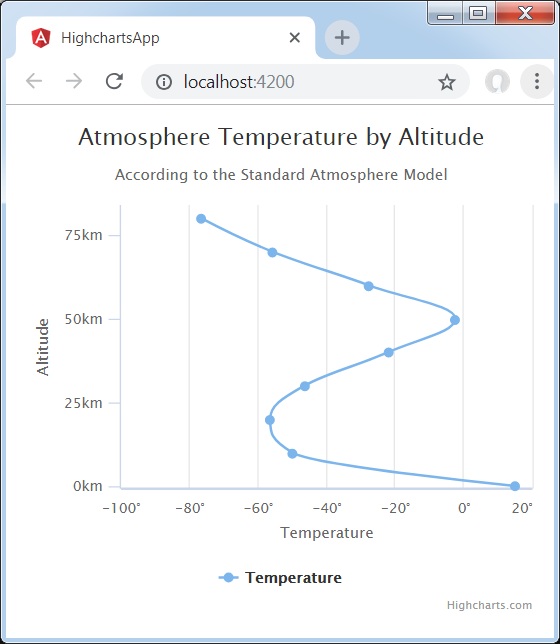
具有倒轴的样条线
我们已经在 Highcharts 配置语法 章节中看到了用于绘制此图表的配置。 现在让我们考虑以下示例,以进一步了解具有倒轴的样条线。
配置
将图表类型配置为基于样条线。 Chart.type 决定图表的系列类型。 这里,默认值为"line"。 配置要反转的轴。 当真正的 x 轴是垂直的且 y 轴是水平的时 - 如果图表中存在条形系列,则同样会反转。 这里,默认值为 false。
var chart = {
   type: 'spline',
   inverted: true
};
示例
app.component.ts
import { Component } from '@angular/core';
import * as Highcharts from 'highcharts';
@Component({
   selector: 'app-root',
   templateUrl: './app.component.html',
   styleUrls: ['./app.component.css']
})
export class AppComponent {
   highcharts = Highcharts;
   chartOptions = {
      chart: {
        type: 'spline',
        inverted: true
      },
      title: {
        text: 'Atmosphere Temperature by Altitude'
      },
      subtitle: {
        text: 'According to the Standard Atmosphere Model'
      },
      xAxis:{
         reversed: false,
         title: {
            enabled: true,
            text: 'Altitude'
         },
         labels: {
            formatter: function () {
               return this.value + 'km';
            }
         },
         maxPadding: 0.05,
         showLastLabel: true
      },
      yAxis: {
         title:{
            text: 'Temperature'
         },
         labels: {
            formatter: function () {
               return this.value + '\xB0';
            }
         },
         lineWidth: 2
      },
      legand:{
         enabled: false
      },
      tooltip: {
         headerFormat: '<b>{series.name}</b><br/>',
         pointFormat: '{point.x} km: {point.y}\xB0C'
      },
      plotOptions: {
        spline: {
           marker: {
              enable: false
           }
        }
      },
      series : [{
         name: 'Temperature',
         data: [[0, 15], [10, -50], [20, -56.5], [30, -46.5], [40, -22.1],
               [50, -2.5], [60, -27.7], [70, -55.7], [80, -76.5]]
      }]
   };
}
结果
验证结果。
❮ angular_highcharts_line_charts.html

